Part 1: How We Reached the Brick Wall Blocking Physician Advocacy
Part I of this series highlights the history of politics and healthcare in creating an unlevel playing field for physicians.
 James C. Denneny III, MD
AAO-HNS/F Executive Vice President and CEO
Otolaryngologists along with other physicians, particularly surgeons, find ourselves increasingly on the losing end of major legislative, regulatory, and private payer decisions and policies that negatively affect the ability to practice and the quality of medicine our patients and the rest of the United States’ citizenry deserve. Our precipitous slide in influence over the direction of the U.S. healthcare system is not accidental in my opinion. It represents an alliance of stakeholders that has not historically acted in concert, at least on the surface. The breadth and depth of their interactions, along with the complexities of the recent COVID-19 pandemic, has created unexpected opportunities for nonphysicians and completely changed the landscape we operate in to the most unlevel playing field that I have seen during my time.
I present to you in my monthly column, which will be a three-part series with part two provided in the March Bulletin EXTRA and part three in the April Bulletin, the following:
- A brief history of healthcare payment in the U.S. that identifies the past and current players and their current roles and relationships.
- A description of how these interrelationships have shaped the events that put us in our current position of declining influence, forcing us to reevaluate our past and current advocacy strategies that reduce effectiveness in the current paradigm.
- A spotlight on options that might change the current situation and paradigm.
Following the conclusion of World War I, the next decade featured, among other things, an expanding economy and industrialization of the country, which also resulted in advances in healthcare. Prior to the October 1929 stock market crash, physicians came together to form Blue Cross to help pay medical bills. As the Great Depression unfolded following the stock market crash, the medical community, both physicians and hospitals, faced increasing difficulty in obtaining payment for their services. They were therefore in support of the first employer-based health insurance in 1932. Later that decade the hospitals formed Blue Shield as a private hospital insurance for the public in 1939. Following the conclusion of World War II in 1945, President Harry S. Truman began exploring a nationalized healthcare coverage system that would eventually lead to President Lyndon B. Johnson signing legislation to create Medicare into law in 1965. Employer-based health coverage continued to gain popularity and market share throughout the 1950s and 1960s and has remained a foundation of healthcare coverage in the U.S., including present day.
With the enactment of legislation to create Medicare in 1965, several key demographics that had been stable for some time were used to calculate future cost. The workforce for the previous decade was approximately 62% men and 38% women. The average length of life for men was 66.9 years and for women, 73.0 years, while Medicare began coverage at age 65. At the time there was no expectation for the dramatic increase in length of life that would occur over the next several decades, as advances in medicine translated into extending lives on a widespread basis.
Medicare was set up into Part A and Part B initially, with hospital coverage in Part A and physician and outpatient services grouped into Part B. Funding for Part A came from a 3% payroll deduction split evenly between the employer and the employee or borne entirely by a self-employed individual. Part B was funded through a 25% premium on the beneficiary, 73% contribution from the general budget, and a 2% contribution from the Medicare trust fund. Those funding sources remain in place today. As the population has grown and number of beneficiaries has increased, the demands on the U.S. Treasury have also increased. Currently the U.S. spends almost $1 trillion a year on Medicare, and it accounts for 10% of costs. Part B spending is expected to surpass Part A spending in 2023. In 1966, physician bills were paid on a “usual and customary” basis by both Medicare and private insurance.
As we moved through the 1970s and 1980s and costs increased, insurance contracting began to change. The Hsiao Harvard study, which was published in 1988, led to the adoption of the Resource-based Relative Value Scale (RBRVS) payment system for Medicare in 1992. Medicare contracted with the American Medical Association (AMA) to manage and value new and existing codes through the Current Procedural Terminology (CPT) and Relative Value Scale Update Committee (RUC) systems, both of which are still in place. Physicians were paid by multiplying the Relative Value Unit (RVU) of the service provided by the conversion factor. There were separate conversion factors for surgical procedures and E/M services, each tied to a budget. Surgeons consistently made their budget while the primary care physicians routinely exceeded their budget. For that reason, a single conversion factor was adopted in the late 1990s and remains in place today.
Concurrently, the Clinton Administration was working on its own reform package while the insurance industry introduced managed care plans that were based on a Kaiser Health Maintenance Organization (HMO) model controlled by primary care. The predicted managed care revolution was rejected by the public and many physicians due to the strong incentives embedded within for not providing care. Meanwhile, Congress added the Sustainable Growth Rate (SGR) in 1997 that became effective in 1998. The yearly SGR fight was created in order for physicians to avoid cuts to the following year’s Medicare Physician Fee Schedule. The SGR was replaced by Medicare Access and CHIP Reauthorization Act (MACRA) in 2015, which promised increased pay for quality through the MIPS process, but alas, the same yearly fight for payment continued and another failed promise.
Through the late 1990s and the first two decades of the twenty-first century, physicians’ unfunded mandates to practice medicine through regulatory policies and legislative action have dramatically increased while the conversion factor is less than it was in 1998. Administrators across the healthcare landscape have increased at a rate almost 10 times greater than physicians and three times greater than any other country. Pharmacy charges now are a significantly greater portion of overall Part B spending than physicians’ reimbursement.
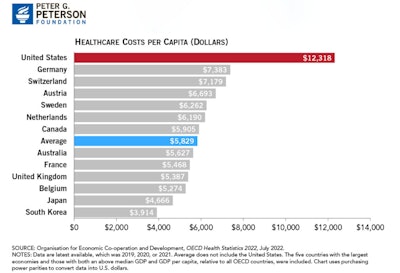
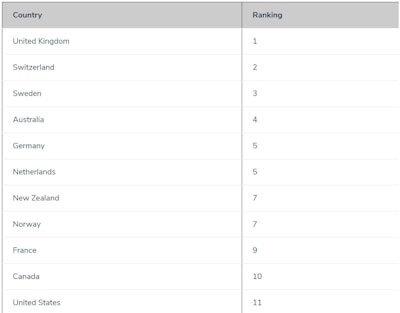
The preliminary discussion would not be complete without identifying and discussing the “elephant in the room,” MONEY. Medicine evolved from a cottage industry to the “healthcare industry complex” that it is today, which represents 10% of the U.S. gross domestic product (GDP). The U.S. spends over $12,000 per capita yearly, whereas Germany, the second highest spender, spends $7,300 per capita annually (Figure 1 and 2). That amount of money brings a lot of players to the game whose primary goal is to preserve or increase their share and who bring varying degrees of expertise and influence to the table. As the size of this complex continues to grow, complexities and advocacy have grown with it. The U.S. also spends considerably more than other industrialized countries on many other sectors, but somehow that never seems to have a place in these discussions. Despite the vast amount of resources spent on healthcare in the U.S., the results as measured by population health, affordable access, efficiency, equity, and quality compared to peer countries are unacceptable.
The bottom line is that when looked at by key decision-makers, their first thought is that we are spending too much.
All of these factors have pushed physician burnout to the highest level ever, reversed the trend to improved work-life balance and integration and stampeded physicians to employment without many of the promised benefits and security. Part 2 in this series, which you will be able to read in the March Bulletin EXTRA, will go into the details of today’s challenges, why they occurred, and ways we can influence improvement in a broken, inefficient system. Part 3, which published in the April issue, delves into options that might change the situation.
 Figure 1. U.S. per capita healthcare spending is over twice the average of other wealthy countries.
 Figure 2. Overall ranking of healthcare system performance in 11 industrialized nations.


