COVID-19 Anosmia Reporting Tool: Subsequent Findings
Severe acute respiratory syndrome coronavirus-2 (SARS-CoV-2), which causes coronavirus disease 2019 (COVID-19) is responsible for a global pandemic that as of February 20, 2022, caused over 5.8 million deaths and over 422 million confirmed cases and over

Early in the history of the pandemic, the World Health Organization and the Centers for Disease Control and Prevention (CDC) advocated fever, cough, and shortness of breath as key symptoms for COVID-19. As the health community continued to accrue experience with the illness, reports regarding profound loss of smell began to surface. Evidence of olfactory dysfunction in COVID-19 patients led ENT UK to recommend that new onset anosmia be considered for COVID-19 infection and to take precautionary isolation.2
The AAO-HNS advised that anosmia, hyposmia, and dysgeusia be considered symptoms for COVID-19.3 Since then, olfactory and gustatory dysfunction (OGD) have become known as a hallmark of COVID-19 infection, and the CDC added smell and taste dysfunction to the symptomatology of COVID-19.4
The data behind the AAO-HNS recommendation were based on crowd-sourced information collected using a web-based questionnaire.5 The data collection platform was built with digital safeguards that ensure anonymity. The reporting tool was hosted on the AAO-HNS website and publicized to membership via email communications, press releases, and social media posts. Data were collected from March 25, 2020, to September 2, 2020, comprising 1,335 usable entries. Preliminary results from this tool were previously published and reflected the first 237 entries, which had been entered up to April 3, 2020.6 Analysis of the total aggregate entries are presented on the following pages.
There was a large volume of entries initially during the roll out (Figure 1). The majority of respondents arrived at the questionnaire through the AAO-HNS website. Overall, the largest source of cases was from patients themselves (62%), with the remainder provided by healthcare workers (Figure 2). Otolaryngologists were the most likely reporting healthcare providers (16%). Demographics of the studied population can be found in Table 1. While responses were largely derived from the United States, 25% of replies were from other countries (Figure 3).
OGD was found to be an early symptom in the subjects, with 70% reporting these symptoms prior to diagnosis and 28% with OGD as one of the initial symptoms (Table 2). This substantiates literature initially supporting this notion.7-11 Additionally, OGD may be the only significant or identifiable symptom, often occurring in the absence of nasal congestion. Early recognition of acute olfactory dysfunction—while not as physically discomforting as other symptoms—can serve to identify individuals with COVID-19 so that they may be tested, receive necessary treatment, and quarantine as early as possible to limit further spread.
Among the subjects, OGD was increasingly one of the symptoms that prompted COVID testing, ranging from 54% of subjects initially in March 2020 to 80% of subjects in August 2020 (Figure 4).
Resolution of OGD was more difficult to determine using the questionnaire. Only 25% reported “resolution” of OGD at the time of case submission. Within this group, the average number of days to this occurrence was 12.5 ± 12.2 days (median 8 days). Of note, more than 76% of those did so by day 14 and more than 88% of those did so by day 21. These data need to be carefully interpreted. First, it is unknown as to when in the course of their illness respondents had the opportunity to answer the questionnaire. Second, respondents were forced to answer in a binary (yes/no) fashion when presented with the question, “Did the anosmia/dysgeusia resolve?” Those that noted resolution variably reported partial to complete resolution.
From the body of early literature, it seems that OGD symptoms largely improve with time, particularly over about a three-week period.8-12 Many patients do have improvement or complete resolution early, even within the first five to eight days.8-9 In a 60-day prospective study, Vaira et al.13 followed 138 patients with objective testing every 10 days. Within the four days of COVID-19 symptom onset, anosmia or severe hyposmia affected 61% of patients. This was reduced to about 15% at 30 days and 6% at 60 days. While improved olfaction occurs over time, it is also evident that after a period of a month or longer some patients still have some degree of objective olfactory dysfunction relative to controls.9,12 Even with return of smell, continued derangements such as parosmia and phantosmia have been noted in 10%-30%.14-15
Crowd-sourced data have the advantage of rapid procurement in a fast-evolving pandemic. One of the early sources suggesting OGD with COVID-19 came from an online survey posted through social networks in Iran16 and initially posted March 27, 2020, on medRxiv.17 Another large symptom data aggregator, the COVID Symptom Study app, is a collaboration with Zoe Global Ltd., a digital healthcare company, and academic scientists from Massachusetts General Hospital and King’s College London.18 The app relies on voluntary participation from the public to self-report demographics and symptoms to study the epidemiology of COVID-19 in real time. As further demonstration of the changing data to inform pandemic epidemiology, researchers from the COVID Symptom Study reported that OGD is a less common symptom among those likely infected by the newer delta and omicron variants of SARS-CoV-2 compared to the alpha variant.19
Limitations of this study include its cross-sectional methodology and, in some cases, short time interval from infection to reporting. The survey solicited cases of anosmia only, which makes it difficult to compare against patient groups who did not have olfactory dysfunction. Participation by patients or physicians was voluntary and may have introduced selection bias. Recall bias may limit accuracy of response as timing between onset of diagnosis and response to questionnaire was not determined. The study was not designed to longitudinally track the course of OGD of each respondent.
Discrimination between different degrees and types of OGD was based upon subjective data. The wide demographic distribution of respondents, bias toward healthcare workers, and bias toward a socioeconomic class of individuals with access to the internet may also enter further selection biases that make generalization to other specific populations difficult. Despite these limitations, the tool was influential in demonstrating OGD as an early and sometimes presenting symptom of COVID-19 infection. Future studies are warranted to understand the natural history of COVID OGD resolution, parosmia rates, effects of treatments, and potential long-term psychosocial effects of OGD on patients.
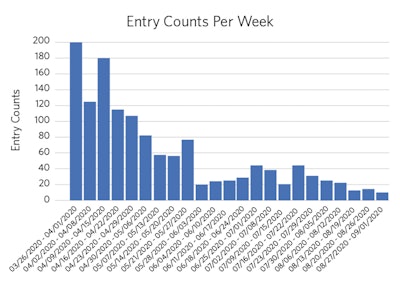 Figure 1. Histogram of entries over time.
Tool development and validation:
The proposed tool was evaluated for content validity in a mixed-methods procedure similar to table of specifications methodology that is employed in psychological research.11 The COVID-19 Anosmia Reporting Tool (CART) was developed with two versions. In the initial version (CART1), the content was originally developed by AAO-HNS Infectious Disease and Patient Safety Quality Improvement Committee members based on emerging evidence within the published literature linking COVID-19 with olfactory and gustatory dysfunction (OGD). Four experts independently reviewed the tool and recommended changes in terms of content and readability.
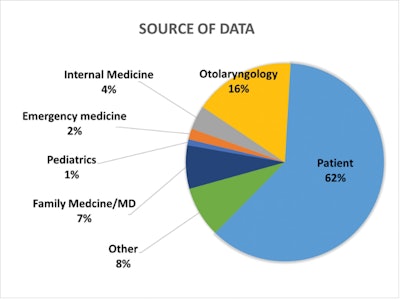 Figure 2. Source of data. “Other” includes categories below 1% representation as well as nonphysician categories. Self-reporters were characterized as “patient.”
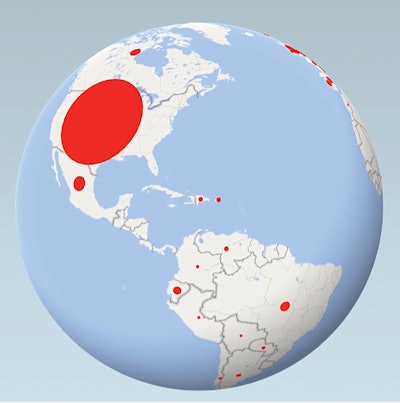 Figure 3. Animated global view of patient entries. Size of red dot corresponds to number of entries from a given country.
The data collection platform was similar to that of the AAO-HNS Patient Safety Event Reporting Tool,12 with built in digital safeguards that certify anonymity. No identifiable user data were solicited. Device internet protocol addresses were not tracked or captured. The reporting tool was hosted on the AAO-HNS website and publicized to membership via email communications and social media posts. Data were collected from March 25, 2020, to September 2, 2020. Descriptive statistics, chi-square tests, and t-tests were used along with an α = 0.05. Approval for this project was secured from the University of Missouri Institutional Review Board.
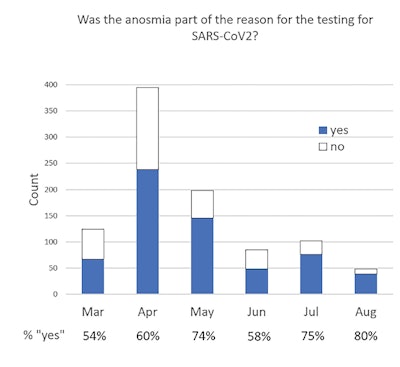 Figure 4. Was the anosmia part of the reason for the testing for SARS-CoV2? Of the patients who developed OGD prior to diagnosis, an increasing percentage of patients reported that OGD instigated COVID-19 testing.
In the 161 days of data accrual, 1,360 entries were made. Five of these were removed due to clinical inconsistencies; 1,355 entries were analyzed. Source of cases were from patients themselves in 62%, with the remainder provided by healthcare workers (Figure 1). Otolaryngologists were the most likely healthcare provider reporters, with 16% of overall reports. There was a large volume of entries initially, spurred from press releases as well as email blasts from AAO-HNS during the initial rollout (Figure 2). The vast majority of respondents arrived at the CART questionnaire through the AAO-HNS website.
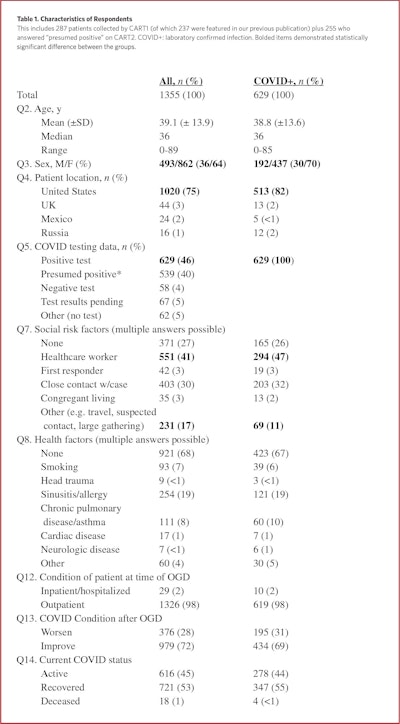
Characteristics of respondents are reported in Table 1. The average subject age was 39.1 ± 13.9 years (median 36 years), with age histogram skewing toward the younger population (Figure 3). Interestingly, the majority of subjects (64%) were female. Self-reporting was significantly associated with female in our report with a X2 of 7.65 and an odds ratio of 1.37 (95% CI, 1.10-1.72). Reports from the United States predominated. In terms of environmental risk factors for COVID-19 infection, the most common was the subject’s position as a healthcare worker (41%), followed by close contact with a confirmed case (30%), and 27% reported no identified factors. Health risk factors are shown in Table 1 as well.
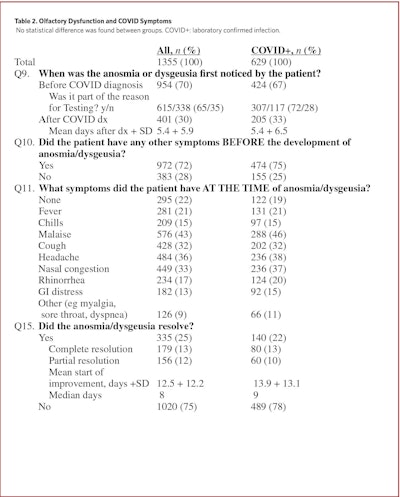
Regarding patients’ evolutionary course of OGD, only 25% reported “resolution” at the time of case submission. Within this group, the average number of days to this occurrence was 12.5 ± 12.2 days (median eight days). Of note, more than 76% of those reported resolution by day 14, and more than 88% of those did by day 21. These data need to be carefully interpreted. First, it is unknown as to when in the course of their illness respondents answered the questionnaire. Second, by the design of skip logic used in questionnaire, only those who answered “yes” when asked, “Did the anosmia/dysgeusia resolve?” received further questions regarding the degree of improvement (partial vs. complete) and its timing. Third, the interpretation of “resolution” by respondents is likely variable. It is quite possible that those who had some improvement of OGD nevertheless answered in the negative, as the question may have been interpreted to be asking only about complete resolution. These individuals would not have seen the follow-up question asking whether resolution was partial versus complete. Yet, there are evidently respondents who interpreted “resolution” as some degree of improvement—half those reporting “resolution” noted having only partial resolution. Thus, this group of respondents may be better characterized as those who acknowledged some degree OGD improvement, although it may not be inclusive of all in this group. This may have biased solicitation of data from those who had faster improvement of anosmia/dysgeusia. It bears noting that approximately 15% of subjects offered information regarding the number of days that elapsed from COVID-19 development to case entry using the tool. On average, the interval was approximately 37 days.
Comparing all group ages for degree of improvement, the group with symptom improvement (complete and partial) was significantly older than those without improvement (40.7 vs. 38.6 years, p = 0.02). The group with complete symptom resolution was significantly older than the group without any improvement (41.1 vs. 38.6 years, p = 0.03).
There was no significant difference in age between the complete and partial symptom improvement groups nor between the partial symptom improvement and no improvement groups. Gender was not associated with symptom improvement on chi-square analysis. Analysis for concurrent symptoms and improvement in OGD demonstrated that both nasal congestion and rhinorrhea were significantly associated (X2 4.59 and 7.88, respectively) with lack of symptom improvement with odds ratio of 1.34 (95% CI, 1.02-1.76) and 1.67 (95% CI, 1.16-2.40), respectively.
The only antecedent symptom associated with lack of improvement was headache, with a X2 of 7.06 and odds ratio of 1.41 (95% CI, 1.09-1.82). Regarding patient risk factors, smoking was found to be significantly associated, with a lack of improvement with a X2 of 5.01 and odds ratio 1.92 (95% CI, 1.08-3.45). Finally, chi-square analysis was applied to all methods of COVID-19 exposure and none were significantly associated with degree of symptom improvement.
Conclusion
We present a large international cohort of subjects with OGD associated with COVID-19, which represents the updated report of the COVID-19 Anosmia Reporting Tool, comprising 1,355 cases. OGD can precede COVID-19 diagnosis and symptoms may take several weeks to improve. Concomitant rhinorrhea, concomitant nasal congestion, antecedent headache, and active smoking are associated with lack of symptom improvement. Of those with symptom improvement, 76% of subjects experienced it by day 14 of illness and 88% did so by day 21.
References
1. Weekly epidemiological update on COVID-19 - 28 December 2021. World Health Organization website. Accessed February 24, 2022. https://www.who.int/publications/m/item/weekly-epidemiological-update-on-covid-19---22-february-2022
2. Loss of sense of smell as marker of COVID-19 infection. ENTUK. Accessed April 11, 2021. http://www.entuk.org/loss-sense-smell-marker-covid-19-infection
3. AAO-HNS: Anosmia, Hyposmia, and Dysgeusia Symptoms of Coronavirus Disease. American Academy of Otolarygology–Head and Neck Surgery. Accessed April 11, 2021. https://www.entnet.org/content/aao-hns-anosmia-hyposmia-and-dysgeusia-symptoms-coronavirus-disease
4. Sypmtoms of COVID-19. Centers for Disease Control and Prevention. Updated February 22, 2021. Accessed April 11, 2020. http://www.cdc.gov/coronavirus/2019-ncov/symptoms-testing/symptoms.html
5. COVID-19 Anosmia Reporting Tool. American Academy of Otolarygology–Head and Neck Surgery. Accessed December 6, 2020. https://www.entnet.org/content/reporting-tool-patients-anosmia-related-covid-19
6. Kaye R, Chang CWD, Kazahaya K, et al. COVID-19 Anosmia Reporting Tool: initial findings. Otolaryngol Head Neck Surg. 2020;163(1):132-134.
7. Saniasiaya J, Islam MA, Abdullah B. Prevalence of olfactory dysfunction in coronavirus disease 2019 (COVID-19): a meta-analysis of 27,492 patients. Laryngoscope. 2021 Apr;131(4):865-878.
8. Lechein JR, Chiesa-Estomba CM, De Siati DR, et al. Olfactory and gustatory dysfunctions as a clinical presentation of mild-to-moderate forms of coronavirus disease (COVID-19): a multicenter European study. Eur Arch Otorhinolaryngol. 2020;277:2251-2261.
9. Vaira LA, Deiana G, Fois AG, et al. Objective evaluation of anosmia and ageusia in COVID-19 patients: single center experience on 72 patients. Head Neck. 2020;42:1252-1258.
10. Moein ST, Hashemian SM, Tabarsi P, et al. Prevalence and reversibility of smell dysfunction measured psychophysically in a cohort of COVID-19 patients. Int Forum Allergy Rhinol. 2020;10(10):1127-1135.
11. Lee Y, Min P, Lee S, Kim SW. Prevalence and duration of acute loss of smell or taste in COVID-19 patients. J Korean Med Sci. 2020 May 11;35(18):e174.
12. Iannuzzi L, Salzo AE, Angarano G, et al. Gaining back what is lost: recovering the sense of smell in mild to moderate patients after COVID-19. Chem Senses. 2020 Dec 5;45(9):875-881.
13. Vaira LA, Hopkins C, Petrocelli M, et al. Smell and taste recovery in coronavirus disease 2019 patients: a 60-day objective and prospective study. J Laryngol Otol. 2020;134(8):703-709.
14. Parma V, Ohla K, Veldhuizen MG, et al. More than smell-COVID-19 is associated with severe impairment of smell, taste, and chemesthesis. Chem Senses. 2020;45(7):609-622.
15. Lechien JR, Chiesa-Estomba CM, De Siati DR, et al. Olfactory and gustatory dysfunctions as a clinical presentation of mild-to-moderate forms of the coronavirus disease (COVID-19): a multicenter European study. Eur Arch Otorhinolaryngol. 2020;17:13.
16. Bagheri SHR, Asghari AM, Farhadi M, et al. Coincidence of COVID-19 epidemic and olfactory dysfunction outbreak. Med J Islam Repub Iran. 2020;34(1):446–452.
17. Coincidence of COVID-19 epidemic and olfactory dysfunction outbreak. mdRxiv. Accessed January 2, 2022. https://www.medrxiv.org/content/10.1101/2020.03.23.20041889v1
18. Drew DA., Nguyen LH., Steves CJ., et al. Rapid implementation of mobile technology for real-time epidemiology of COVID-19. Science. 2020;368(6497):1362-1367. doi:10.1126/science.abc0473
19. What are the symptoms of Omicron? ZOE. Updated December 21, 2021. Accessed January 2, 2022. https://joinzoe.com/learn/omicron-symptoms


