Tech Talk: Growing Role of Big Data
Harvesting business intelligence from data is nothing new. What makes Big Data different are the three Vs: volume, velocity, and variety.
Mike Robey, MS, AAO-HNS/F Senior Director, Information Technology
Harvesting business intelligence from data is nothing new. Decision support systems and executive information systems have been around since the 1980s. What makes Big Data different are the three Vs: volume, velocity, and variety. Today’s datasets are huge. Volumes in the terabyte (2 to the 40th power. 240) and petabyte (2 to the power of 50. 250) range are common. Multiple datasets, from internal and external sources, are needed for complex analysis. Combined with the velocity of which new data is getting created, a traditional organization-specific computing environment cannot keep up with demand. To further complicate things, today’s data is not just transactional. Meta data, monitoring systems, documents, online postings, and other unstructured data add to the variety of data produced today. Big Data is the field that includes the repositories to support the analysis from these huge disparate sources. This article introduces the major components to give you a better understanding.
Where Is Big Data Stored?
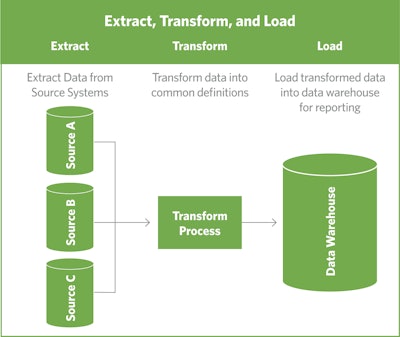
Two terms you may have heard are data warehouses and data lakes (see sidebar for definitions). Both have one thing in common: They are separate repositories than the source systems. Having separate databases for business intelligence and reporting is not new. The rationale is to not hinder the ability of the source system to record transactions. Relational databases, consisting of rows and columns, are excellent structures to support transactions. They are not the most efficient for multidimensional reporting, such as time series. Multidimensional analytical data structures were developed to support complex business intelligence reporting. These were fed from disparate source systems so as not to hinder the integrity nor ability of the source systems to do their intended job.

ETL is managed by an overall data governance policy, which defines the lifecycle of the data and various implemented controls governing availability, usability, consistency, data integrity, and data security. Included in data governance are other documents such as Master Data Management, which provides a common definition for the reference data found across the different source systems. The Data Dictionary defines the data elements to be extracted and their transformed layout for loading into the data warehouse. Data privacy ensures that personally identifiable information (PII) is properly protected.
With the data layer covered, let us discuss the data scientist who will be doing the analytics. Harkening back to an undergraduate class is econometrics, any analysis begins with a question or hypothesis to be tested. The iterative methodology is defined with the following steps:
- Develop a hypothesis
- Refine the hypothesis into a mathematical model
- Align data elements to the model’s variables
- Check the model's adequacy; run statistical analysis to ensure variables are independent
- Test the hypothesis against the derived model
- Use the model for prediction and forecasting
To be effective, a data scientist needs these skills:
- Computer science: Knows how to write code, understands databases, and Big Data architectures
- Advanced math skills: Trigonometry and geometry skills (many of the algorithms used to identify proximity of like items are nonlinear)
- Quantitative analyst: Statistics background, visual analytics, experience with unstructured data
- Scientist: Evidence-based decision making; an understanding of the scientific method
- Strong communications skills: Ability to frame the topic for understanding
Now with the data layer identified and the data scientist introduced, let us talk about outcomes. Big Data analytical activities can be organized into two broad categories: an inward focus and an outward focus. Inward focus on topical areas, such as cost reduction, decision improvement, and improvements in products and services, is nothing new. However, the three Vs of Big Data can help improve products and services. For example, with the onset of the Internet-of-Things, appliances and automobiles report service issues back to manufacturers that then use this data to improve products and services. An outward focus on opportunities, changes, and threats is also supported by Big Data.
You can think of Big Data as the third wave of the Industrial Revolution, with each wave defined by the main source of energy: steam → electricity → data. Labor becomes more specialized with each new wave. Similarly, you can think of the last 50 years of the Computer Age defined by computing → networking → Big Data. The computing phase started with the mainframe computer and evolved to include personal computers and now smartphones. The networking phase began with local area networks in the 1980s and the internet in the 1990s. The computing and networking phases provided the technology to support parallel processing and huge distributed datasets. Equally important, organizations are now enabled to think more broadly than simply recording transactions.
Finding skilled data scientists is key to the effective use of Big Data for focused analytical activities. But so, too, is finding the right balance between applying the scientific method (hypothesis → experimentation → customer reaction observation → adjustment) for growth opportunities and maintaining daily operations.


