Diversity in Our Ranks
Duane J. Taylor, MD Chair, Diversity Committee The charge of the Diversity Committee is as follows: “To educate and promote diversity and inclusion in all its forms including gender, race, religion, socioeconomic status, disability, geographic location, sexual orientation, age, and culture within our membership and especially in our leadership. To promote cultural sensitivity and competence in concert with other Academy committees first to the membership and medical schools and then to the public for the best treatment of ear, nose, throat, head and neck disease…” As a part of our effort, the search for data that looks at the diversity of our specialty in the U.S. was set in place, and the most comprehensive recent information was obtained from the Association of American Medical Colleges (AAMC) report “Diversity in the Workforce Facts and Figures 2010.” This article presents some of this extracted data and information as it pertains to our specialty, to encourage our members to review the report, and to consider how this information might enable us as a specialty in preparing and developing our workforce and managing our increasingly diverse patient population. (See Figure 1.) As is clearly indicated in the beginning of the report, “The bulk of the data presented in this publication only covers physicians who graduated from U.S. MD-granting medical schools between 1978 and 2008. Therefore, these data do not reflect all current practicing physicians in the workforce. For example, doctors of osteopathic medicine (DOs), international medical school graduates (IMGs), and practicing physicians who graduated prior to 1978, among others, are not included.” Prior to presentation of the report data, several points are discussed and include an introduction on “Diversity, Disparities, and the Data,” which cites several studies that state, “In terms of healthcare delivery, research indicates that physicians from racial and ethnic minority backgrounds are themselves more likely to treat racial and ethnic minority patients, and more likely to set up practice in typically underserved communities.” It also expands upon the idea that a more diverse workforce in healthcare is a key to eliminating healthcare disparities. The second area discussed in the report prior to presentation of the data was “Expanding our Notion of Diversity to Improve Healthcare.” As was indicated in the report, “… diversity continues to embrace race, ethnicity, nationality, and gender, while expanding the concept to encompass sexual orientation, religion, geography, disability, age, language, gender identity, and much more…” The final discussion prior to presentation of the data is “Physician Workforce Diversity: Necessary, But Not Sufficient,” and this segment explores the critical importance of “assembling a workforce that is diverse along many dimensions,” however, also realizing that this alone will not allow us to adequately care for our ever-changing diverse population. The report is extensive and looks at many aspects of the distribution and diversity across all specialties. However, some of the information extracted regarding our specialty has been placed into charts and tables for demonstration and review. Percent of total U.S. physicians in Figure 1. Asian (1,066) 1.8% Black/African American (219) 0.7% American Indian/ Alaska Native (23) 0.9% Hispanic/Latino (258) 1.0% White (5,561) 1.6% Total (7,127) 1.5% Otolaryngology specialty, women by race and ethnicity, 2008 Asian 271 Black/African American 72 American Indian/Alaska Native 5 Hispanic/Latino 49 White 935 Total 1,332 Practice specialty , men by race and ethnicity, 2008 Asian 793 Black/African American 147 American Indian/Alaska Native 18 Hispanic/Latino 209 White 4,625 Total 5,792 Otolaryngology specialty by census size of practice areas, race, and ethnicity, 2008 1 Million or More 250,000-999,999 100,000 -249,999 < 100,000 Asian 893 94 35 42 Black/African American 185 18 4 12 American Indian/Native Alaska 17 2 1 3 Hispanic/Latino 201 32 9 16 White 3,527 980 494 559 Total 4,823 1,126 543 632 Practice specialty by census size of practice areas and sex, 2008 1 Million or More 250,000 – 999,999 100,000 – 249,999 < 100,000 Women 1,010 167 79 76 Men 3,813 959 464 556 The information and data compiled and accumulated above is to be a source for stimulation of discussion, understanding, and consideration of how we as individuals, an organization, and a specialty might better look at the future of our specialty, the workforce, and our preparations to serve our patient population. It also motivates us to review this information and see how it aligns with any current information that our Academy has compiled. Reference Diversity in the Physician Workforce Facts & Figures 2010. Laura Castillo-Page, PhD, Director of Research, Diversity Policy and Programs. Published by the Association of American Medical Colleges, Diversity Policy and Programs. Summer 2010.
Duane J. Taylor, MD Chair, Diversity Committee
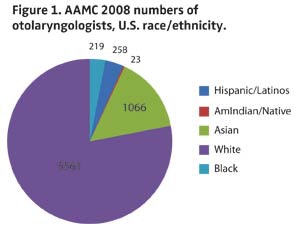 Figure 1. AAMC 2008 numbers of otolarygologists, U.S. race/ethnicity
The charge of the Diversity Committee is as follows: “To educate and promote diversity and inclusion in all its forms including gender, race, religion, socioeconomic status, disability, geographic location, sexual orientation, age, and culture within our membership and especially in our leadership. To promote cultural sensitivity and competence in concert with other Academy committees first to the membership and medical schools and then to the public for the best treatment of ear, nose, throat, head and neck disease…”
As a part of our effort, the search for data that looks at the diversity of our specialty in the U.S. was set in place, and the most comprehensive recent information was obtained from the Association of American Medical Colleges (AAMC) report “Diversity in the Workforce Facts and Figures 2010.” This article presents some of this extracted data and information as it pertains to our specialty, to encourage our members to review the report, and to consider how this information might enable us as a specialty in preparing and developing our workforce and managing our increasingly diverse patient population. (See Figure 1.)
As is clearly indicated in the beginning of the report, “The bulk of the data presented in this publication only covers physicians who graduated from U.S. MD-granting medical schools between 1978 and 2008. Therefore, these data do not reflect all current practicing physicians in the workforce. For example, doctors of osteopathic medicine (DOs), international medical school graduates (IMGs), and practicing physicians who graduated prior to 1978, among others, are not included.”
Prior to presentation of the report data, several points are discussed and include an introduction on “Diversity, Disparities, and the Data,” which cites several studies that state, “In terms of healthcare delivery, research indicates that physicians from racial and ethnic minority backgrounds are themselves more likely to treat racial and ethnic minority patients, and more likely to set up practice in typically underserved communities.” It also expands upon the idea that a more diverse workforce in healthcare is a key to eliminating healthcare disparities.
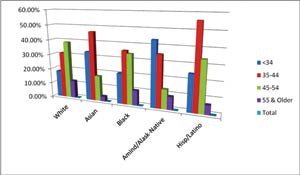 Diversity in the otolaryngology workforce distribution by age race/ethnicity
The second area discussed in the report prior to presentation of the data was “Expanding our Notion of Diversity to Improve Healthcare.” As was indicated in the report, “… diversity continues to embrace race, ethnicity, nationality, and gender, while expanding the concept to encompass sexual orientation, religion, geography, disability, age, language, gender identity, and much more…” The final discussion prior to presentation of the data is “Physician Workforce Diversity: Necessary, But Not Sufficient,” and this segment explores the critical importance of “assembling a workforce that is diverse along many dimensions,” however, also realizing that this alone will not allow us to adequately care for our ever-changing diverse population.
The report is extensive and looks at many aspects of the distribution and diversity across all specialties. However, some of the information extracted regarding our specialty has been placed into charts and tables for demonstration and review.
Asian (1,066) 1.8%
Black/African American (219) 0.7%
American Indian/ Alaska Native (23) 0.9%
Hispanic/Latino (258) 1.0%
White (5,561) 1.6%
Total (7,127) 1.5%
Asian 271
Black/African American 72
American Indian/Alaska Native 5
Hispanic/Latino 49
White 935
Total 1,332
Asian 793
Black/African American 147
American Indian/Alaska Native 18
Hispanic/Latino 209
White 4,625
Total 5,792
| 1 Million or More | 250,000-999,999 | 100,000 -249,999 | < 100,000 | |
| Asian | 893 | 94 | 35 | 42 |
| Black/African American | 185 | 18 | 4 | 12 |
| American Indian/Native Alaska | 17 | 2 | 1 | 3 |
| Hispanic/Latino | 201 | 32 | 9 | 16 |
| White | 3,527 | 980 | 494 | 559 |
| Total | 4,823 | 1,126 | 543 | 632 |
| 1 Million or More | 250,000 – 999,999 | 100,000 – 249,999 | < 100,000 | |
| Women | 1,010 | 167 | 79 | 76 |
| Men | 3,813 | 959 | 464 | 556 |
The information and data compiled and accumulated above is to be a source for stimulation of discussion, understanding, and consideration of how we as individuals, an organization, and a specialty might better look at the future of our specialty, the workforce, and our preparations to serve our patient population. It also motivates us to review this information and see how it aligns with any current information that our Academy has compiled.
Reference
Diversity in the Physician Workforce Facts & Figures 2010. Laura Castillo-Page, PhD,
Director of Research, Diversity Policy and Programs. Published by the Association of American Medical Colleges, Diversity Policy and Programs. Summer 2010.

